China Risk, Credit Booms, and Hedges--what's a PM to do?

If you’re of a certain age, you remember what you were doing on election night in 2000. Al Gore was declared the winner around 11pm, or was it Bush? It was too close to call. Back before we did everything on touch screens, NBC anchor Tim Russert kept a whiteboard of the states that were still up for grabs. By midnight, it was clear Florida was the one state that would put either candidate over the top. Russert famously erased all the other states on his board, and wrote, “Florida, Florida, Florida.”
If I were on tv talking about emerging markets, it wouldn’t be too much of an exaggeration to write “China, China, China” on my EM white board. As I mentioned in my post on Monday, the resurgence in production, growth and stability in China over the last year has led a to a very supportive environment for emerging markets assets after a dreadful couple of years. While there are danger signs, the ball could keep rolling for quite a while. How can we assess the risks in China, and build a resilient portfolio accordingly that is robust to the possibility of a hard landing?
I won’t go over all this ground again….you know the drill: China manages the economy and financial markets to maximize the political stability of the regime. China devours commodities like a stray dog set loose on a Vegas buffet. China has capital controls to prevent money from fleeing too quickly. Chinese investors are inflating a property bubble for lack of alternative investments destinations. China has an ever expanding credit stock that the authorities struggle to manage so it simultaneously keeps growth humming while not imperiling the country’s financial stability.
How are they doing on that last one? Our friends at the New York Fed have looked at the data, and determined, you’ll never believe this--China is experiencing a credit boom.
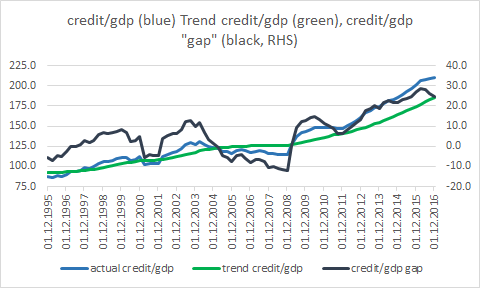
The IMF defines an expansion in credit in an economy as a “credit boom” when one of two criteria are met: 1) the deviation of the annual growth rate of credit/gdp exceeds 1.5x of the trend standard deviation over the past ten years, and the credit/gdp ratio exceeds 10%, or 2) the annual growth rate of the credit/gdp ratio exceeds 20 percent. Without spending too much time abusing the data, China has been in a credit boom since 2012.
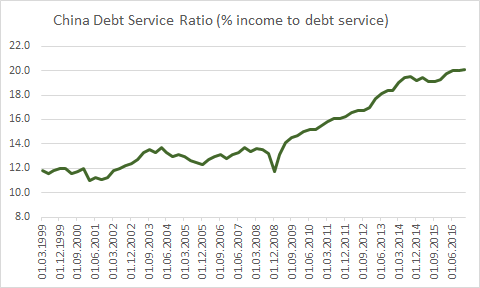
Similarly, the Bank of International Settlements has studied a number of different metrics for “early warning indicators” of a banking crisis. Their data suggests there are two indicators that consistently outperform other measures as “EWIs”. The credit/gdp “gap”, which is the gap between how fast credit is growing relative to a five year trend, and the country’s debt service ratio. The DSR is a measure of what percentage of income is devoted to debt service, or repayment of principal and interest. The higher this ratio goes, the less income there is leftover to spend on, well, anything else.
The credit/gdp “gap” moved into the danger zone back in 2012 and has kept on truckin’ ever since.
As one would expect from an economy with a rapidly growing credit/gdp ratio, the DSR has been on a tear since the post-GFC stimulus measures of 2009--and on an absolute basis, reaching a point where countries have hit the wall in the past.
Also, the BIS notes below that there are a couple of “red lights” for China in their “EWI” analysis--in this measure, DSR is expressed as a deviation from the five-year mean, which illustrates how quickly the ratio has been accelerating. Both the BIS and IMF have noted the more quickly a credit boom expands, the higher probability of an ugly ending.
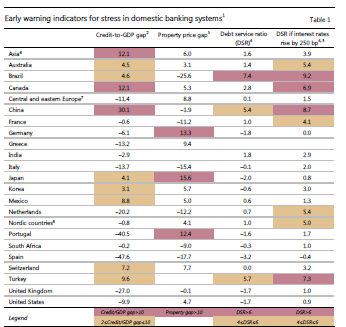
When you add in some aspects of the shadow banking system and credit growth including “nationalized” bank debt taken on by local governments, one can argue the credit “boom” is even larger than the narrow, relatively conservative definitions in the BIS and IMF data.

Alright you say--we’ve heard it all before...nothing to see here, please move along...But what is the probability of an ugly ending? The IMF’s study of the history of credit booms determined there are often two consequences of a credit boom: 1) a financial crisis, and 2) economic underperformance, defined by six years of growth 2% or more below trend, or both.
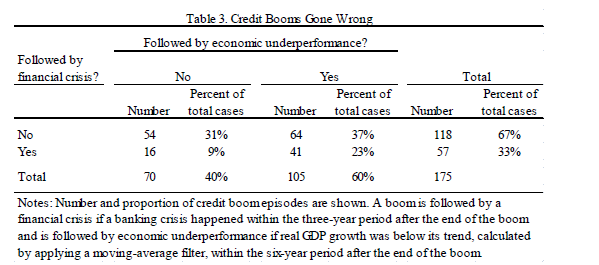
In 69% of cases, one or the other, or both occurred at the end of the credit boom. The paper suggests the other 31% were cases where there were significant financial and structural reforms that caused an increase in productivity, or credit was coming from such a low and underdeveloped level that the credit boom caused the economy to catch up to “normal” levels of credit. China continues to kick the can down the road on structural reforms, and pre-boom credit/gdp ratios were already above 100%, so there is little to suggest the economy is simply developing a healthy credit market.
Whew...ok, lots of numbers there. Given China’s role in global credit expansion and commodity demand, it is clear how and why China is so important to emerging markets, and probably a systemic risk. In the past three years we’ve also seen the delta of Chinese demand to EM financial stability and growth. But the credit data shows nothing much has changed!! The stress, vol, capital outflows and FX deval of 2014-2016 could be better defined as a breather more than any significant deleveraging.
So as a portfolio manager, how do you deal with China risk? Here, I’ll borrow from the esteemed market strategist/philosopher Dylan Grice:
“One problem is that many of the big moves we’re supposed to ‘trade around’ are fundamentally unpredictable “Taleb’s Black Swans), and no amount of research will predict such events. Perhaps a more important thought is that we’re simply not hardwired to see and act upon the big moves that are predictable (Taleb’s Grey Swans).”
The data suggests there is a significant chance, maybe as high as 7 in 10, that China will experience a significant decrease in growth, a financial crisis, or both, in the next five years. Given Dylan’s point above, and well known behavioral biases, do you think that these risks are baked into vol markets that are at historical lows? Me either. But even if it is, it is certainly a “grey” swan and not a black one. The good news is by buying some vol, we’ll pick up protection against completely unpredictable events along the way. Let’s cast the net for some hedges.
Again, with apologies to Mr. Grice, here’s what I think is true about China.
-Chinese credit is expanding fast, and historical data suggests it is prone to disaster
- there’s too much debt there, and probably everywhere else too
-Central banks are likely to react to any credit stress in China with the same elixir: more credit.
And here is what I know is true about China:
-There is plenty of uncertainty--There are smart people that think China has the resources to recapitalize the banking system and/or high enough domestic savings to weather a credit storm.
-a financial crisis or significant decrease in current and future growth expectations would cause a spike in volatility in emerging markets.
-We have no idea when.
Given these constraints, and our hypothesis that the market is underpricing long-term risk of a China driven calamity, we want to use volatility to build in some EM and commodity sensitive hedges which will 1) give some gamma and upside to capital flight or a metastasizing crisis should property and/or credit markets turn ugly quickly, and 2) give us more staying power in long-side trades we’ll need to make our PnL budget if we waiting for Godot (finally, that intro to drama class I took freshman year pays off).
We’ll get into the long-side carry trades another day. Here are a few ideas for hedges in what is by no means an exclusive list.
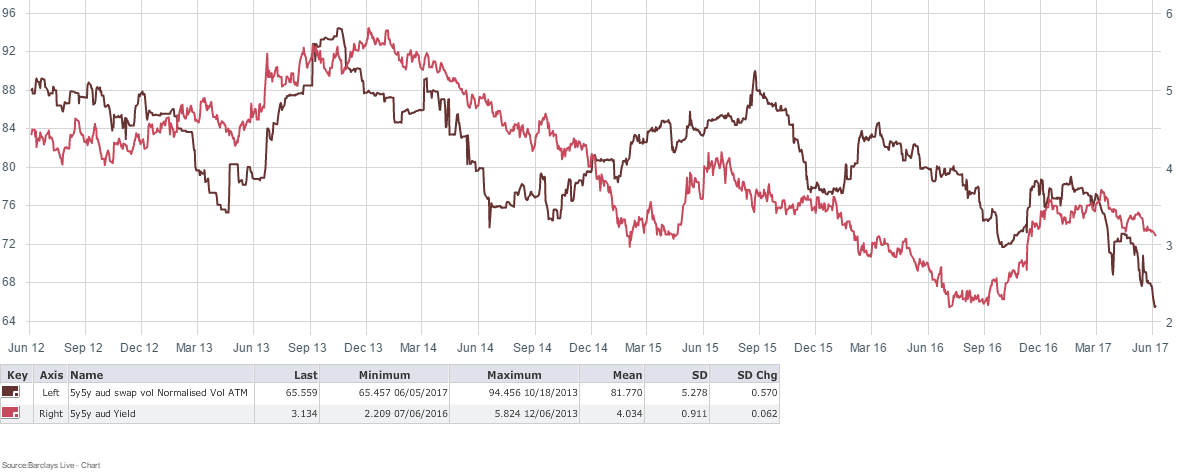
It is no secret Australia has huge exposure to Chinese demand. The price of this ATM 5y5y AUD receiver swoption is about 48bps per year. The black line below shows just how far through previous lows Aussie swoption vol has fallen. The red line represents the 5y5y rate, which is nearly 100bps off the lows from last year.
CAD receiver swoptions would likely offer good value as well for the same reasons.
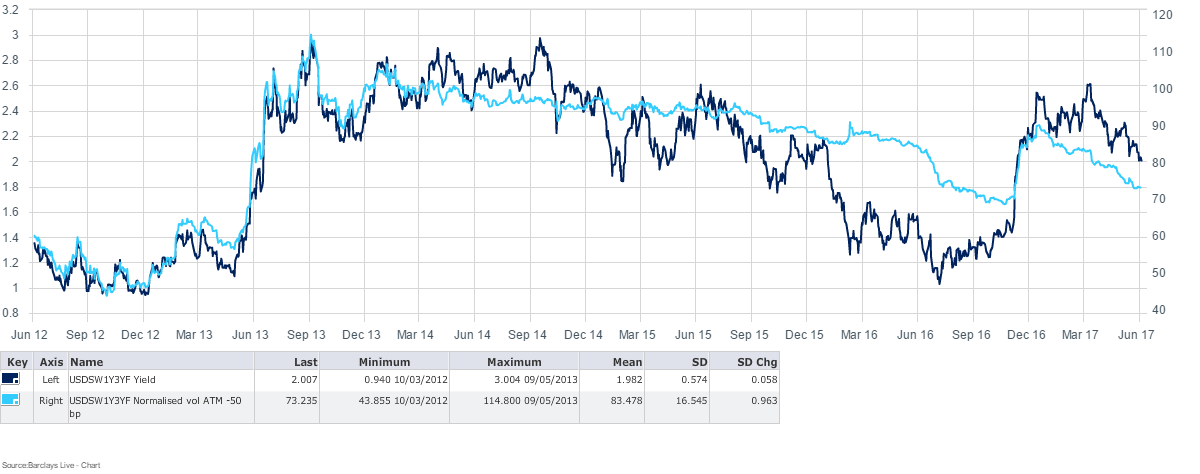
The flattening of the USD curve this year has unwound virtually all hikes by the Fed beyond this year. In a Chinese hard landing the curve could invert as the market prices a return to ZIRP. The price of this 3y- 1y USD receiver swoption would be around 12 bps per year for three years. The chart shows US rate vol isn’t quite as cheap as some other hedges but it is a liquid and straightforward way to gain exposure to a reversal in the Fed’s tightening cycle.
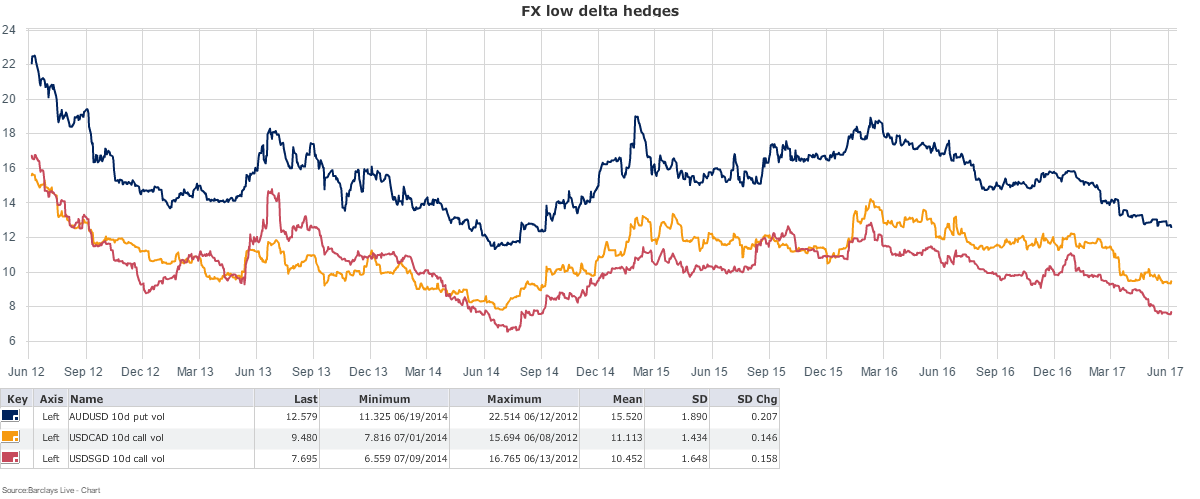
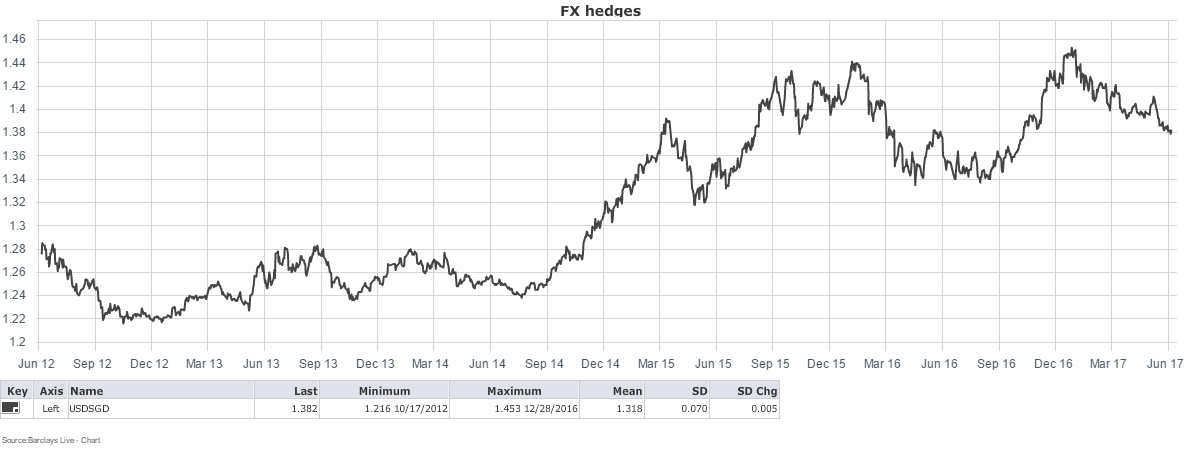
In the FX world, we can grab some low delta put options on China-exposed currencies. We’ll use AUD and CAD again, and add in SGD, which has very low rates and trades like a basket of Asian currencies dependent on Chinese demand.
This chart represents the implied vols for a portfolio of 2 year, 10 delta USD call options on AUD, CAD, and SGD. The implied vols we see here are through the levels from just before the taper tantrum, and very close to the levels from just before commodity prices in general, and oil prices in particular, started to fall in mid-2014. These currencies will all get pummeled if China rolls over.
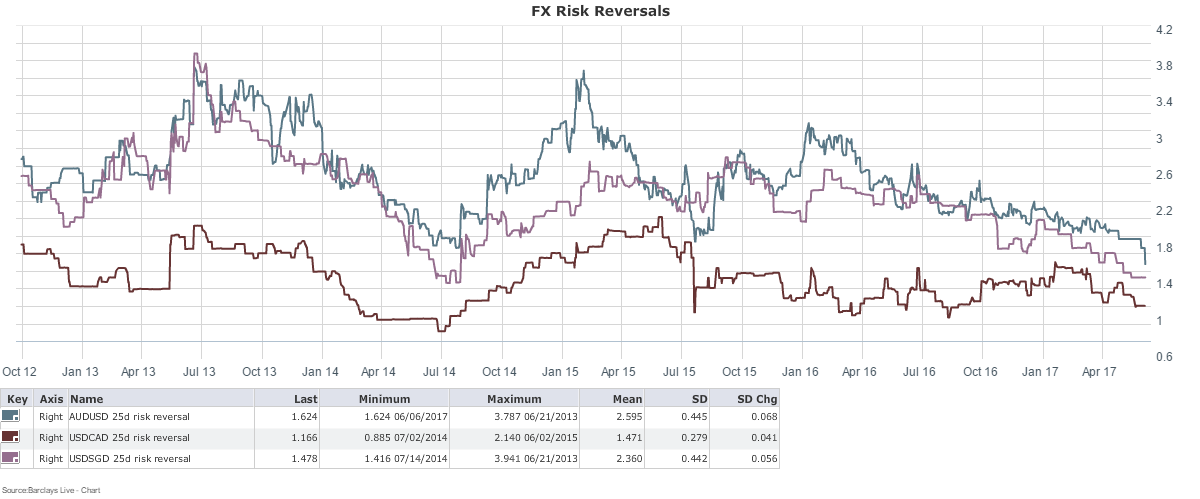
Similarly, 2-year, 25 delta risk reversals have reached some very complacent levels. CAD is scraping along the lows, as is SGD, while AUD is blowing right through. These trades would give you cheap gamma to trade around when and if vol accelerates.
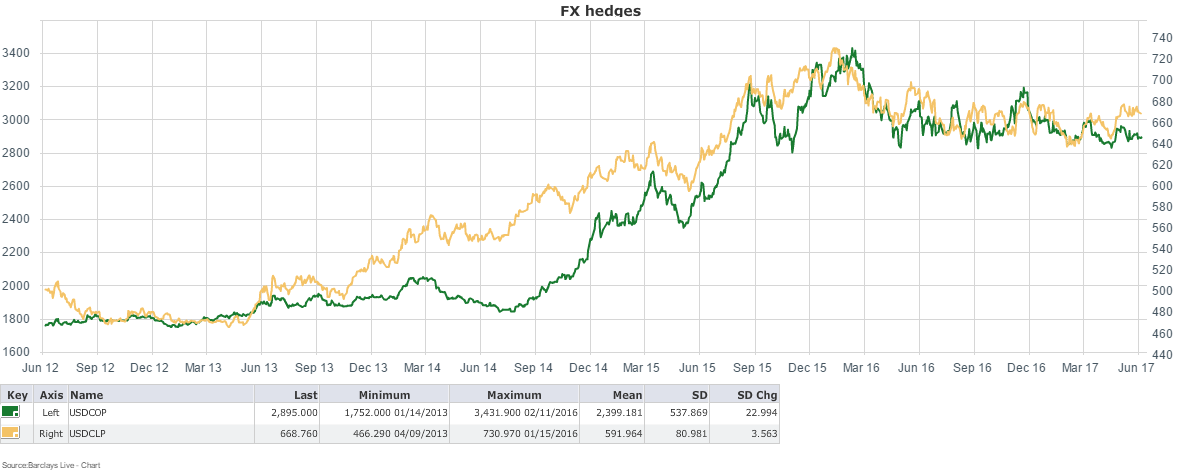
Outright shorts in CLP and COP will give us some reasonably priced exposure to two commodity intensive currencies, with very easy to swallow annual carry of around 3% and 5% respectively. Colombia in particular has structural problems, low real rates, a persistent current account deficit and vulnerability to lower oil prices. Despite this, the currency that has rallied 14% from the 2016 lows. Chile practically begs a macro trader to short its currency given its high dependence on copper prices, significant USD-liabilities in the corporate sector and highly leveraged consumers. Chile also has near zero real yields that will dive to negative territory in a China hard landing.
In addition to the SGD puts and gamma noted above, outright short SGD has some merit as well, given its low carry, linkages to global trade and the banking/finance sector.
For the FX option trades we can simply size the premiums to generate negative carry that we are comfortable with relative to overall risk, our PnL budget, or expected positive carry and rolldown, whatever metric works the best. The outright shorts are a little more complicated since our objective here is to hedge tail risk and build long-term staying power for a broader portfolio. But these long USD positions are attractive on a micro level and will also add some protection against an increase in inflation and a bear steepening of global rate curves.
Putting it all together--we can pick and choose a few of these hedges that are currently on offer at fire sale prices and size our hedge portfolio in such a way that we have significant positive gamma should the bloom come off the EM story’s rose. We don’t know the future--but we can prepare for it. These hedges will manage some of the uncertainty surrounding China and give us the latitude to seek out smart long side trades while preparing for the worst.
Comments
Post a Comment